Michael BlebySenior Reporter
Feb 14, 2020 – 3.30pm
Land sales boomed in the September quarter as an unexpected pick-up in the residential housing market following the May federal election fuelled demand for lots for newly built homes, the latest industry figures show.
The pick-up was more pronounced across the six state capital cities, which accounted for nearly two-thirds of all sales and where transactions of land lots zoned for new homes jumped 27.7 per cent from the June quarter. Sales in regional areas, by contrast, rose 12.5 per cent.
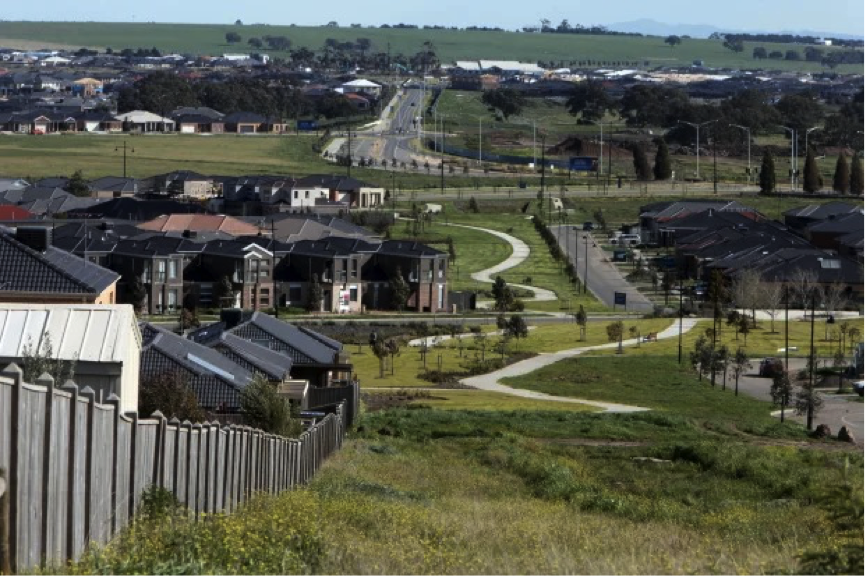
Road to recovery: Markets for new residential land are picking up. Erin Jonasson
The price and sales figures for the September quarter, based on data from 46 regions across the six states, are dated and lag the residential housing price data by some four months. But they give an indication that the pick-up in the housing market during the three-month period did boost the market for new dwellings.
“What we are seeing is rising confidence and the increase in land supply is an encouraging result,” said Housing Industry Association chief economist Tim Reardon, whose organisation produced the report with data provider CoreLogic.

“All aspects of the market are picking up to a rate more consistent with demographic demand.”
This was the second quarterly gain in the largest markets of Sydney, Melbourne, Brisbane and Perth after a pick-up that started in June. The latest increase, which lifted the total number of transactions to 10,563 in the third quarter, marked a near-46 per cent increase from March’s record low.
But the boost in volumes had little effect on median prices, which rose just 0.7 per cent during the quarter in cities and 0.6 per cent in the regions. Across the cities, prices remain down 2.1 per cent on a year earlier, suggesting a recovery has further to go.
In Sydney, where lot prices have risen 63.2 per cent over the past decade, the median price rose 2.9 per cent to $445,000 in the quarter. In Melbourne, where prices have more than doubled over the 10-year period, they fell 2.8 per cent quarter on quarter to $350,000.
But the median lot size itself varies by location and over time, and per-lot prices do little to reveal the underlying cost of land. The report shows that on a per-square-metre basis, Sydney land prices have continued to march higher, rising 3.9 per cent in the September quarter from a year earlier to $1118.
This annual rate of gain was topped only by Perth, which showed a 4.1 per cent yearly increase to $717 per sq m. Melbourne land dropped 9.6 per cent from the third quarter of 2018 to $777 per sq m and Brisbane fell 2 per cent to $581.
Hobart lot sizes rose to a record $184,750 in the September quarter – with the median lot size growing to 685sq m – even as the city’s price per square metre fell 2.7 per cent from a year earlier.
But the HIA-CoreLogic report said a lack of consistent and clear regulatory processes increased land costs and approvals required at different stages – such as bushfire hazard, native vegetation and threatened species, waste management and traffic management – and could even create uncertainty about whether a development would be allowed.
“The outcome of this overlap, confusion and cost is often that despite land being residentially zoned and subdivided and sold, there is still a risk that a person who buys that land may not be able to build a home, or to do so, they are faced with further reports, costs and time delays to prove its [sic] okay,” the report said.
“The planning system in place across Australia should provide certainty on the application of planning controls on residential land.
“This can be done by disclosing all known constraints at the earliest stage in the land supply process as possible, nominating when constraints will apply and what steps will need to be taken to address those constraints.”

