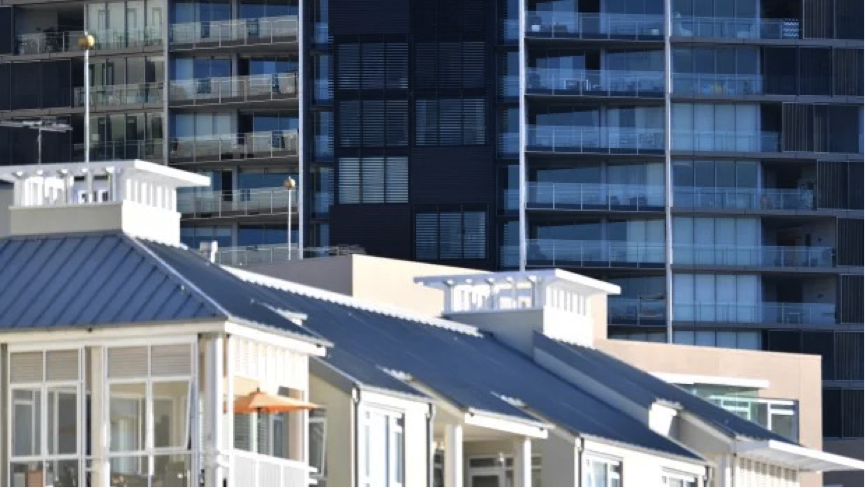
With many houses in Sydney, Melbourne and Brisbane priced above $1 million, the more affordable apartment sector may well benefit disproportionately from this growth cycle.
Richard WakelinContributor
Feb 18, 2020 – 9.47am
Demand for property is unusually diverse, underpinning its renewed overall strength. The latest lending data from the Australina Bureau of Statistics shows first-home buyers increased 10 per cent over the December quarter, with a 9 per cent increase in both home switchers and investors.
Although the overall December quarter jump of 9 per cent still leaves lending demand 15 per cent below its March 2017 peak, a continuation of the recent growth would soon see that top scaled.

Apartment price growth has trailed houses in most places due to the surge in supply of newly-built stock. Sam Mooy
The broad-based growth demonstrates that constraints on lending – a key feature of the market in 2018 and 2019 – are dissipating.
The bounceback for investors is especially remarkable as they had faced the biggest challenges.
The Australian Prudential Regulation Authority had throttled the growth of banks’ investor lending books.
Advertisement
Interest-only loans, the borrowing product of choice for tax-optimising investors, were either off the menu or priced with unappetisingly high interest rates. And until the surprise May 2019 election result, there was a fear about the end of negative gearing benefits.
Nevertheless, there remains significant scope for further investor growth, given total investor lending is 40 per cent below its 2015 peak.
So collectively, investors are likely to bring more firepower to the market to challenge first home buyers and home switchers. But where will be the greatest impact?
The ABS has recently started to report on the number of each buyer cohort in the market, as well as their total dollar borrowings. From this, we can calculate average loan amounts. Unsurprisingly, first home buyers typically borrow the least, at around $413,000 each. Next are home-switchers at $429,000, with investors borrowing $432,000.
These numbers don’t equate to total buying power as home switchers will have some (often considerable) equity from their current home to spend on the next property. However, it illustrates that the greatest competition in property is in the sub-$1 million category.
With many houses in Sydney, Melbourne and Brisbane priced above $1 million, the more affordable apartment market may well benefit disproportionately from this growth cycle.
There are caveats. We know that apartment market price growth has trailed houses in recent years in most places due to the surge in supply of newly-built stock. Most of that wave has passed, but the new apartment pipeline is still significant, and may eventually rebound if developers regain their confidence and fears about cladding health and safety and the cost of rectification recede.
The early evidence from the recovery is that apartment prices are recovering, but the performance continues to lag houses.
CoreLogic reports 4.6 per cent growth for houses and 2.9 per cent for apartments across the capital cities for the January quarter.
Naturally, no investor buys an asset class, just a single property, one at a time. There are limits to the inferences one draws from this high-level data.
Prospective investors need to retain a focus on picking the right property in the right location: one that has a track record of capital growth.
If their budget extends to a house, buy that. But if the budget is below $1 million, also have confidence that the right apartment will also work and may be undervalued at the moment.

